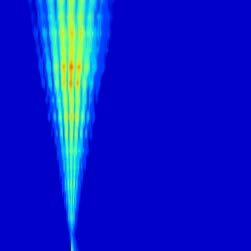
Time series data is used in many areas of research and various ways to represent this kind of data is available. However not a lot of research has been done to determine which kind of data representations leads to the best results when performing automated analysis of time series data. Five different neural networks have been tested with three different types of data representation as input in order to determine which of them leads to the best results. In order to further improve network performance four different kinds of data augmentations have also been tested in order to show which of these is most effective in improving network performance. The dataset used contains data from various earthquakes in the Groningen seismological region. Using spectrograms as input leads to a small performance increase in all cases when compared to the other data representations. Thus, spectrograms should be the first data representation to look at when deciding which data representation to use for analysing time series data.

